Electrocardiogram (EKG)
Donghee Kim, Ph.D.
(Reading Assignment: Chapter 17 of Berne and Levy.)
A. Structural basis for current flow
Action potentials can propagate from one to the next cell in cardiac muscle, allowing a coordinated wave of depolarization to occur. How does the current flow so easily from cell to cell? Pictures obtained from electron microscopy show that there is a specialized structure in cardiac cells called intercalated disc at the ends of each cell. Within this area are structures called gap junctions that are ion channels with a large conductance. These large channels allow ions to move across easily, i.e., current can pass from one cell to the next with little resistance. (In other words, the cells are electrically coupled).
Gap junction channels are composed of six connexon subunits that surround a central pore. We now know that gap junction channels can be regulated by intracellular ions such as H+ and Ca2+. Both acidosis and an increase in Ca2+ (this occurs in myocardial ischemia or hypoxia) can reduce the open state of the channel, and thereby increase the resistance between two cells, leading to abnormal conduction.

Reprinted from Principles of Physiology 3rd ed., (2000) by R.M. Berne & M,N. Levy, with permission from Elsevier.
Cells comprising the human heart.
A: Working myocardial cell of the ventricle, showing intensely staining cross-striations, central nuclei, and intercalated discs.
B: Purkinje fiber shows large, faintly staining cells with sparse cross-striation.
B. Conduction pathways.

Conduction velocity
| SA node | <0.01 m/s |
| Atrial myocardium | 1.0 – 1.2 m/s |
| AV node | 0.02-0.05 m/s |
| AV bundle | 1.2 – 2.0 m/s |
| Bundle branches | 2.0 –4.0 m/s |
| Purkinje network | 2.0 –4.0 m/s |
| Ventricular myocardium | 0.3 – 1.0 m/s |
C. Electrical basis of electrocardiogram

Figure. Excitation and recovery of a small strip of myocardial tissue in a volume conductor (saline bath), and the resulting electrical potential between two electrodes, a and b, at a distance from the strip. 1, strip in resting state. Left end of strip is stimulated, so that a front of excitation moves from left to right. The advancing front of excitation is electrically equivalent to a row of batteries, or dipoles, with their positive poles to oriented toward the direction of advance. Subsequent repolarization, assumed in this example to proceed in the same left-to-right sequence, is equivalent to a row of reversed dipoles.
A strip of muscle is placed between two electrodes attached to a voltmeter that measures the potential difference between the two electrodes a and b. Now inject a current to the cells on the left side (stimulus). An action potential will be generated in this area and propagate toward the right. As the electrical activity moves from left to right, the voltmeter will record the potential difference between a and b. The voltmeter is connected in such a way that the recording pen moves upward when b is electrically positive with respect to a. The depolarization and repolarization then produces the upward and downward deflections, respectively. By convention, depolarizing wave moving toward the positive electrode produces an upward (positive) signal.
The human body (a three-dimensional conductive medium or a volume conductor), because it is three-dimensional and asymmetrical, produces much more complex waveforms. However, the basic principles are the same as those of a simple two-dimensional tissue described above.
A dipole is an electrical source consisting of an asymmetrically distributed electrical charge. The heart can be depicted as a dipole in a volume conductor because one position of the myocardium is depolarized while the remaining regions are still in their resting state at any instant during the spread of a wave of depolarization.

Einthoven triangle, illustrating the galvanometer connections for standard limb leads I, II and III.
D.Standard Limb leads: Bipolar vs. unipolar leads
Dr. Willem Einthoven (1860-1927) recorded the first accurate EKG waves in 1903. Einthoven introduced the standard limb leads which are still used today. The three biopolar electrodes placed on the left arm, left leg and right arm form a triangle referred to as the Einthoven triangle.
Bipolar Leads: Both electrodes are influenced by the cardiac dipole. Neither one is at zero potential.

Conventional terms for electrocardiographic waves and intervals.
Remember that each lead looks at the heart from a different point of view. Therefore, the magnitude and the direction are different for each lead. Nevertheless, they look very similar. The depolarization moving toward the positive electrode produces an upward (positive) deflection on the EKG.
P wave - atrial depolarization (action potential begins in atria)
QRS complex - ventricular depolarization (large mass means greater size)
T wave - ventricular repolarization (why an upward deflection? because the epicardium repolarizes before the endocardium and thus the negative charge wavefront is moving from epi- to endocardium). This is because the action potential duration is shorter in the epicardial tissues.
U wave - believed to be due to repolarization of the papillary muscle
P-R interval - time taken from first atrial depolarization to first ventricular depolarization
Q wave - is by definition the first downward deflection of the QRS and may or may not be present
E. Mean QRS complex
The cardiac dipole can be represented as a vector with magnitude and direction. The mean QRS vector represents the mean electrical vector generated by ventricular depolarization. Measurement of the angle of this vector provides an important part of clinical electrocardiographic analyses.


A normal axis (or normal direction) of the QRS vector generally lies between 0 and 90 degrees. A right axis shift would occur if there is right ventricular hypertrophy or left ventricular infarction. A left axis shift would occur if there is a left ventricular hypertrophy or right ventricular infarction.
F. Augmented unipolar leads
Three unipolar limb leads are recorded in clinical electrocardiography along with the standard bipolar limb leads. Unipolar leads measure the potential difference between an exploring electrode that is affected by the cardiac dipole and an indifferent electrode that records the sum of the other two electrodes.
The exploring leads are called aVR, aVF and aVL (a stands for augmented; V for potential and R for right). Consider the exploring electrode as the positive electrode. Then, an upright deflection would be recorded in aVF during ventricular depolarization, since the wave of depolarization is moving toward the aVF electrode. Similarly, a negative deflection would be recorded by aVR since the wave of depolarization is moving away from this electrode.


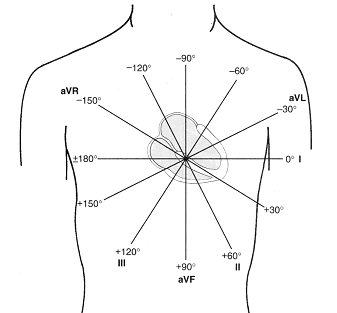
Three standard limb leads and three augmented leads look at the frontal plane of the heart every 30 degrees.
Leads II, III and aVF are called “inferior leads”.
Leads I and aVL are called “left lateral leads”.
G. Chest leads
The six chest leads (V1-V6) make up the remainder of the conventional 12-lead EKG. These are unipolar leads that record the potential difference between a central terminal (can be considered as zero potential) and electrodes at each of six positions on the chest wall. QRS complexes recorded in leads V1 and V2 are normally inverted as the wave of depolarization moves away from these leads that are on the right side of the chest.


Lead Position of exploring electrode
V1 4th intercostal (between the ribs) space just to the right of sternum
V2 4th intercostal space just to the left of sternum
V3 Midway between V2 and V4
V4 5th intercostal space at the left midclavicular (mid-collar bone) line
V5 left anterior axillary (armpit) line horizontally to the left of V4
V6 midaxillary line horizontally to the left of V4 and V5

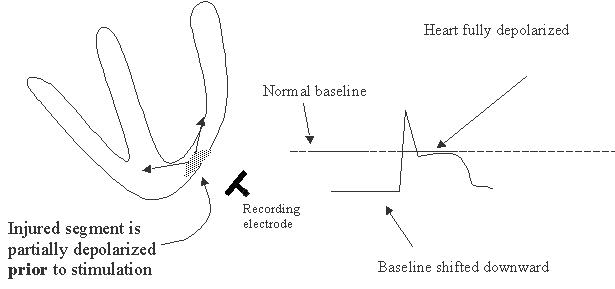
H. Myocardial ischemia and infarction:
In patients with myocardial ischemia or infarction, EKG recording shows either elevated or depressed ST segment. During diastole, an "injury current" is present in the heart, causing the potential difference between two leads to be non-zero. This "injury potential" is either positive or negative depending on the area of infarct. The dotted line is the isoelectric line. At systole when all parts of the heart are depolarized including the ischemic or infarcted area, no potential difference is recorded, and therefore the ST segment is at the zero level.
Transmural (partial or complete)
Non-transmural MI (subendocardial)

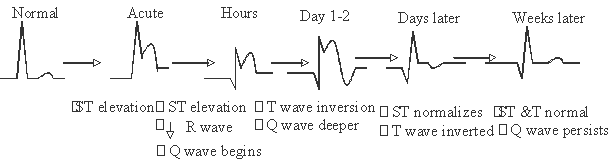
Gradual changes in EKG recording following myocardial ischemia (for your info only)
Pathologic Q wave (This is for your information only).
A hallmark of transmural myocardial infarction is the “pathologic Q wave”. The pathologic Q wave is larger than normal, and develops in the leads overlying the infarcted tissue because necrotic muscle does not generate action potentials. Such Q waves are permanent evidence of a myocardial infarction. In the diagram below, depolarization sequence is recorded by lead aVL overlying a lateral wall infarction (black region). A pathologic Q wave is generated due to the absence of electrical activity in the infarcted region.
In cases where the infarction is not transmural but involves a subendocardial layer, pathologic Q wave does not form and therefore is called “non-Q-wave infarctions”.
Often, deviations in T wave occur during acute myocardial infarction (MI). For example, a peaked T wave may be seen followed by T wave inversion after 1-2 days (see lecture slides).

