Acid-Base Balance
A Respiratory Approach
L.Ebihara MD-PhD
Assigned reading: Chapter 6, pages 83-87 from West, Respiratory Physiology-The Essentials, 7th ed.
Normal cellular function requires that the concentration of free protons ([H+]) in body fluids be maintained within certain limits. Vital proteins such as enzymes, transporters, ion channels, peptide hormones, receptors and mediator protein molecules are sensitive to Δ[H+] in their environment. The small radius of H+ (10-9 μm or 10-15 meter) enables it to reach and interact with reactive sites within a protein molecule, altering its conformation and function.
Disturbances of acid-base homeostasis are common, particularly accompanying acute cardiovascular, pulmonary, metabolic , and/or renal complications. Deviations of [H+] outside the normal range can have profound effects on cell metabolism and membrane function. Severe deviations may lead to coma and death. The range of [H+] compatible with life is approximately 16-160 nM (pH: 6.8-7.8).
Ventilation has the dual function of supplying O2 for cell metabolism and removing the CO2 produced in the course of metabolism. In order for ventilation to meet the body’s metabolic needs, a dynamic relationship exists among three key variables: metabolic rate (expressed as CO2 production), arterial blood PCO2, and alveolar ventilation rate. PaCO2 is the primary factor controlling ventilation. Changes in PaCO2 translate into Δ[H+] (or ΔpH) in the arterial blood. Therefore, ventilation may be viewed as a pH control system. To understand how this pH control system works, we will first review a couple of basic concepts in acid-base chemistry.
Ionization Constant Equation
For acetic acid  :
:

This relationship can also be expressed using the Henderson-Hasselbalch (HH) equation:

Where  and
and  . For acetic acid,
 . This equation shows the direct relationship between pH and the ratio of the protonated and unprotonated forms of the acid.
Chemical buffers, the lungs, and the kidneys represent the three defense systems against disturbances of pH homeostasis.
Buffering pH
Buffers are compounds that prevent or minimize the Δ[H+] (or ΔpH) resulting from the addition of acid or base to a system. A buffer pair is made up of a weak acid and its conjugate base. Ideally, the pKa of this system should be equal or close to the desired pH of the solution. The addition of 100 mmoles of HCl to 1 L of water containing 200 mmoles /L of acetate ion causes conversion of about half the acetate to acetic acid, thereby eliminating much of the added H+ ion and minimizing Δ[H+] (i.e., buffering the pH). In a buffer system composed of HB and B-, the undissociated acid (HB) protects the pH against the addition of bases (or OH-) while the conjugated base (B-) guards against the addition of acid (H+).
Buffering Capacity
The buffering capacity of a buffer system is a measure of its ability to produce or absorb protons. The buffering capacity is determined by two factors:
- The total amount of buffer available.
- The fraction of buffer in its protonated form. This is determined by the pKa of buffer system relative to the pH of the solution. For example, acetic acid has a pKa of 4.7 which means that at a pH of 4.7, 50% of acetate will be in the protonated form. Ideally, the pKa of a buffer system should be equal or close to the desired pH of the solution in order to maximize its buffering capacity.
Buffer systems of the blood
The major buffer systems of the blood are: bicarbonate buffer system; hemoglobin; proteins; phosphate.
The bicarbonate buffer system consists of CO2 and HCO3- . Dissolved CO2 can be converted to HCO3- by the following reaction:

The relationship between pH, dissolved CO2 and can be also described using the Henderson-Hasselbalch equation:

where 6.1 is the pKa and the concentration of dissolved CO2 is expressed as the product of its solubility coefficient (α=0.03mmoles/L per torr)times PCO2. [HCO3-] is given in mmoles/L.
The most important extracellular buffer is the bicarbonate buffer system. This is due to several factors:
1. HCO3- is the most abundant buffer base in the blood. The normal value for [HCO3-]2 gas which can then be removed by the lungs. The body normally maintains the PaCO2 at 40 mm Hg (dissolved CO2 = 1.2 mmoles/L) by increasing or decreasing the rate of ventilation.

This makes the bicarbonate buffer system a much more effective buffer system than it would otherwise be predicted to be based on its pKa.
2. The concentration of bicarbonate in the blood is regulated by the kidneys.
Acid-Base Disorders
Acid-base disorders can be classified as being either respiratory or metabolic. In a respiratory disorder, the primary problem is an excessive retention or elimination of CO2. In a metabolic disorder, the primary problem is an excessive retention or elimination of bicarbonate. There are 4 basic types of primary acid base disorders:
- Respiratory acidosis - main problem: increasing arterial PCO2
- Respiratory alkalosis – main problem: decreasing arterial PCO2
- Metabolic acidosis – main problem: decreasing [HCO3-]
- Metabolic alkalosis – main problem: increasing [HCO3-]
The Blood-Buffer Line

Figure 1. Davenport diagram. From JB West, Respiratory physiology-The Essentials, 7th ed.
The relationship between [HCO3-], CO2 and pH in blood can be shown on a Davenport diagram (Figure 1). The line CAB is called the blood-buffer line and is the relationship between HCO3- and pH as carbonic acid is added to whole blood. The slope of this line is much steeper than that measured in aqueous solutions or separated plasma. This is because in blood, the binding of protons by hemoglobin increases the production of HCO3- that occurs when the PCO2 increases in order to satisfy the equilibrium relationship for the bicarbonate buffer system.

Respiratory Acidosis and Alkalosis
If we hyperventilate there will be a drop in arterial PCO2, a rise in arterial pH plus a small decrease in arterial [HCO3-]. These changes can be described using the Davenport diagram (Figure 1) by moving from point A along the normal blood buffer line toward point C. This condition is referred to as an acute respiratory alkalosis. The opposite changes occur when we hyperventilate and can be described using the Davenport diagram by moving from point A along the normal blood buffer line toward point B. This condition is called an acute respiratory acidosis.
Metabolic Alkalosis or Acidosis and Base Excess
The normal blood buffer line goes through point A (pH = 7.4, [HCO3-] = 24, PCO2 = 40 mm Hg) on the Davenport diagram. If we add or eliminate HCO3- while maintaining the PCO2 fixed at 40 mmHg, we will move alone the 40 mmHg isobar away from point A.

This will produce either a positive or a negative base excess (BE) where “base excess” is defined as the difference between the observed and predicted [HCO3-]:

The observed [HCO3-] can be calculated from the pH and PCO2 values: . The predicted [HCO3-] is the value predicted from the normal blood buffer line and the observed pH. It can be calculated using the equation:

where Hb = [hemoglobin] in g/100ml
In a person with normal [Hb] of 15 g/100ml of blood, this equation becomes:

The BE corresponds to the δ[HCO3-] not due to a ΔPCO2. A negative BE (i.e. a base deficit) is due to consumption of HCO3- by an acid load and indicates a metabolic acidosis. By contrast, an alkali load results in a positive BE base excess, which points to the presence of metabolic alkalosis. As we have already seen, we can define a series of isobars depending on the PCO2. We can also define a series of parallel blood buffer lines depending upon the BE (see Figure ). If we superimpose a respiratory disturbance on a non-respiratory (metabolic) one, we will move along a blood buffer line that is displaced from the normal line by a distance equal to the value for BE.

Evaluation of the Acid-base Status
To evaluate the acid base status we need to consider both the respiratory status (which isobar are we on?) and the metabolic status (which blood buffer line are we on?). With a pure metabolic disturbance we remain on the normal PCO2 = 40 isobar, but can develop either a negative BE or a positive BE by moving away from the normal point along this isobar. With a pure respiratory disturbance we remain on the normal blood-buffer line, but can move along it from one isobar to another. However, acid-base disturbances are rarely pure. A primary metabolic disturbance is often accompanied by a respiratory compensation and vice versa. Also, it is not uncommon for two primary disturbances to coexist in the same patient at the same time. It is usefull to graphically represent the components defining the acid base status using the relevant isobar, as determined by the PCO2, and the relevant blood buffer line, as determined by the value for BE.
Let’s consider two simple examples:
In a patient with a chronic respiratory acidosis due to emphysema, we might observe an elevated arterial PCO2 of 60 mmHg, a plasma [HCO3-] of 32 mmoles/L and an arterial pH of 7.35. The predicted [HCO3-] under these conditions is 24.5 mmoles/L so there is a BE of + 7.5 mmoles/L. To represent this graphically we consider two components: (a) a respiratory acidosis, moving us along the normal blood buffer line to the 60 mmHg isobar; and (b) a metabolic (renal) compensatory increase in [HCO3-], moving us along the 60 mmHg isobar to an arterial pH value of 7.35, and producing the BE of +7.5 mEq/L.
In a patient with an acute metabolic alkalosis due to vomiting, we might observe a base excess of +4.7, an arterial PCO2 of 48 mmHg, and an arterial pH of 7.4. We can diagram this as (a) a metabolic alkalosis, which moves us along the normal isobar nearly to the +5 BE blood-buffer line, with (b) a compensatory hypoventilation, which moves us along this new blood-buffer line to the PCO2 = 48 mm Hg isobar, producing an arterial pH of 7.4. Respiratory compensation for a metabolic disturbance is very rapid, and can be complete.

It is important to bear in mind that, especially if compensation is complete, we cannot determine from the acid-base values alone what the underlying difficulty is. As in the examples just given, additional information (vomiting) is usually available to help us deduce the nature of an acid-base disturbance.
The acid-base values alone may be used to make an educated initial guess as to the type of disturbance, according to the following diagram. The rationale behind this diagram is illustrated by the following examples. If we start at the normal point and assume incomplete compensation:
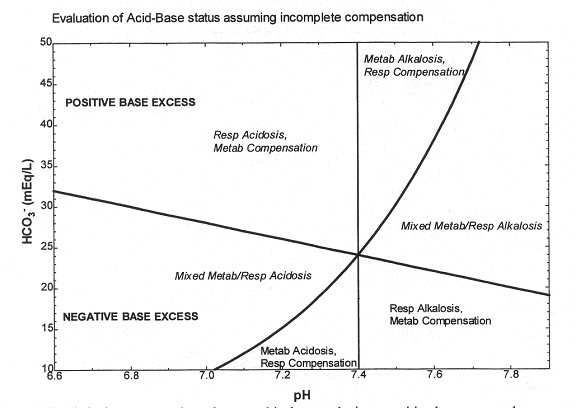
Figure 5
A metabolic alkalosis moves us along the normal isobar, producing a positive base excess; the respiratory compensation moves us back toward the normal pH along the new blood buffer line, leaving us in the indicated portion of the diagram.
A metabolic acidosis moves along the normal isobar to produce a negative base excess; the respiratory compensation again moves us back towards the normal pH, and leaves us in a different region of the diagram.
Comments (0)
You don't have permission to comment on this page.